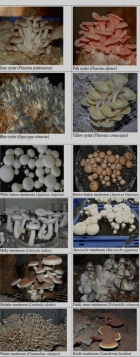
Figure 1
Edible Mushrooms and Their Holistic Approach on Health
Das T and Roy B and Bhattacharyya S*
Published: 14 August, 2023 | Volume 7 - Issue 1 | Pages: 078-087
Figure 1:
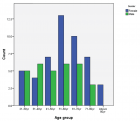
Figure 1: Body weight and epididymal fat content on the last day of the feeding trial. Mice were given a low-fat diet (LFD, n = 8), high-fat diet (HFD, n = 8), diet containing 0.5% ASG additions to HFD (0.5% ASG, n = 8), or a diet containing 1.0% ASG additions to HFD (1.0% ASG, n = 8). Each value is shown as mean ± standard deviation. The significance test shows that ANOVA and Tukey’s multiple comparison test showed significant differences at the 5% or 1% level. *:p < 0.05, **:p < 0.01.
Read Full Article HTML DOI: 10.29328/journal.afns.1001053 Cite this Article Read Full Article PDF
More Images
Similar Articles
Recently Viewed
-
Success, Survival and Prognostic Factors in Implant Prosthesis: Experimental StudyEpifania Ettore*, Pietrantonio Maria, Christian Nunziata, Ausiello Pietro. Success, Survival and Prognostic Factors in Implant Prosthesis: Experimental Study. J Oral Health Craniofac Sci. 2023: doi: 10.29328/journal.johcs.1001045; 8: 024-028
-
Agriculture High-Quality Development and NutritionZhongsheng Guo*. Agriculture High-Quality Development and Nutrition. Arch Food Nutr Sci. 2024: doi: 10.29328/journal.afns.1001060; 8: 038-040
-
A Low-cost High-throughput Targeted Sequencing for the Accurate Detection of Respiratory Tract PathogenChangyan Ju, Chengbosen Zhou, Zhezhi Deng, Jingwei Gao, Weizhao Jiang, Hanbing Zeng, Haiwei Huang, Yongxiang Duan, David X Deng*. A Low-cost High-throughput Targeted Sequencing for the Accurate Detection of Respiratory Tract Pathogen. Int J Clin Virol. 2024: doi: 10.29328/journal.ijcv.1001056; 8: 001-007
-
A Comparative Study of Metoprolol and Amlodipine on Mortality, Disability and Complication in Acute StrokeJayantee Kalita*,Dhiraj Kumar,Nagendra B Gutti,Sandeep K Gupta,Anadi Mishra,Vivek Singh. A Comparative Study of Metoprolol and Amlodipine on Mortality, Disability and Complication in Acute Stroke. J Neurosci Neurol Disord. 2025: doi: 10.29328/journal.jnnd.1001108; 9: 039-045
-
Development of qualitative GC MS method for simultaneous identification of PM-CCM a modified illicit drugs preparation and its modern-day application in drug-facilitated crimesBhagat Singh*,Satish R Nailkar,Chetansen A Bhadkambekar,Suneel Prajapati,Sukhminder Kaur. Development of qualitative GC MS method for simultaneous identification of PM-CCM a modified illicit drugs preparation and its modern-day application in drug-facilitated crimes. J Forensic Sci Res. 2023: doi: 10.29328/journal.jfsr.1001043; 7: 004-010
Most Viewed
-
Evaluation of Biostimulants Based on Recovered Protein Hydrolysates from Animal By-products as Plant Growth EnhancersH Pérez-Aguilar*, M Lacruz-Asaro, F Arán-Ais. Evaluation of Biostimulants Based on Recovered Protein Hydrolysates from Animal By-products as Plant Growth Enhancers. J Plant Sci Phytopathol. 2023 doi: 10.29328/journal.jpsp.1001104; 7: 042-047
-
Sinonasal Myxoma Extending into the Orbit in a 4-Year Old: A Case PresentationJulian A Purrinos*, Ramzi Younis. Sinonasal Myxoma Extending into the Orbit in a 4-Year Old: A Case Presentation. Arch Case Rep. 2024 doi: 10.29328/journal.acr.1001099; 8: 075-077
-
Feasibility study of magnetic sensing for detecting single-neuron action potentialsDenis Tonini,Kai Wu,Renata Saha,Jian-Ping Wang*. Feasibility study of magnetic sensing for detecting single-neuron action potentials. Ann Biomed Sci Eng. 2022 doi: 10.29328/journal.abse.1001018; 6: 019-029
-
Pediatric Dysgerminoma: Unveiling a Rare Ovarian TumorFaten Limaiem*, Khalil Saffar, Ahmed Halouani. Pediatric Dysgerminoma: Unveiling a Rare Ovarian Tumor. Arch Case Rep. 2024 doi: 10.29328/journal.acr.1001087; 8: 010-013
-
Physical activity can change the physiological and psychological circumstances during COVID-19 pandemic: A narrative reviewKhashayar Maroufi*. Physical activity can change the physiological and psychological circumstances during COVID-19 pandemic: A narrative review. J Sports Med Ther. 2021 doi: 10.29328/journal.jsmt.1001051; 6: 001-007

HSPI: We're glad you're here. Please click "create a new Query" if you are a new visitor to our website and need further information from us.
If you are already a member of our network and need to keep track of any developments regarding a question you have already submitted, click "take me to my Query."


