
More Information
Submitted: September 26, 2024 | Approved: September 30, 2024 | Published: October 01, 2024
How to cite this article: Kareem RA, Razavi SH, Mousavi Z. Survival of Free and Encapsulated Probiotics in Healthy Gummy Candy as a Carrier for Probiotic Capsules. Arch Food Nutr Sci. 2024; 8(1): 029-037. Available from: https://dx.doi.org/10.29328/journal.afns.1001059
DOI: 10.29328/journal.afns.1001059
Copyright License: © 2024 Kareem RA, et al. This is an open access article distributed under the Creative Commons Attribution License, which permits unrestricted use, distribution, and reproduction in any medium, provided the original work is properly cited.
Keywords: Probiotics; Antioxidant activity; Gummies; Capsule; Polyphenols

Survival of Free and Encapsulated Probiotics in Healthy Gummy Candy as a Carrier for Probiotic Capsules
Raghda Abdulhussain Kareem1, Seyed Hadi Razavi2* and Zeinab Mousavi2
1Directorate of Agricultural Extension and Training, Ministry of Agriculture, Iraq, A PhD Student of the Department of Food Science, Engineering and Technology, University of Tehran, Karaj, Iran
2Department of Food Science, Engineering and Technology, Faculty of Agricultural Engineering and Technology, University of Tehran, Karaj, Iran
*Address for Correspondence: Seyed Hadi Razavi, Department of Food Science, Engineering and Technology, Faculty of Agricultural Engineering and Technology, University of Tehran, Karaj, Iran, Email: [email protected]
Probiotic gummy candy is an innovative food that can be used as a carrier to deliver probiotics. This study aimed to manufacture healthy gummy candy (HGC) as a carrier for probiotic capsules. The ingredients' effect on the viability of probiotic capsules and free cells was evaluated for 48 days under refrigerated conditions. Also, the textural properties, overall acceptability of products, and physicochemical properties were tested. The encapsulation probiotics in sodium alginate and chitosan provided a high efficiency of 88.16%. At the same time, the encapsulated cells-based HGC (HGC-C) had higher counts of probiotics than free cells-based HGC, and it remained above the 3 log CFU/g at the end of the 48-day storage period in HGC-C, while the free cells reached zero at 30 days. The HGC product showed a low hardness value and high antioxidant capacity as well as, and the colour coordinates for the product showed more yellow, with an intense red colour. Using mango pulp and probiotics in gummy candies is an innovative and viable alternative to the confectionery industry; therefore, combining fruits as a source of prebiotics and probiotic bacteria could be a promising formula for probiotics gummy supplement preparation.
In recent decades, synthetic additives have been less accepted because of food safety issues and consumers' concerns about their harmful effects on their health [1]. Combinations of probiotics and natural materials confer health benefits to the host [2,3]. Moreover, regular consumption of probiotics has many significant therapeutic effects on human health, such as protection against diarrheal diseases, inflammatory disorders, and hypercholesterolemia, as well as exhibiting anti-cancer, anti-diabetic, and antioxidant effects by enhancing host immunity and strengthening the intestinal barrier [4,5]. Lactobacillus plantarum and Lactobacillus paracasei are well known to have several properties, including antimicrobial and anti-adhere activities against several pathogen productions of organic acids, hydrogen peroxide, and bacteriocins [6,7]. In addition, it can modulate the human gut microbiota by suppressing growth and opportunistic invasion [8]. Various factors may reduce the beneficial effects of probiotics, e.g., during food processing, storage conditions, and gastrointestinal transiting; in line with this, encapsulation is a crucial way to deal with these issues and enhance the viability of probiotics in the human gastrointestinal tract [9,10]. Confectionery products such as chewing gum and gummies are trendy among consumers [11]. Bartkin, et al. [12] and Lele, et al. [2] reported that gummy candies are a good choice as a carrier for essential oils and probiotics. Using natural juices, fruit purees, or fruit by-products improves gummies and jellies' sensory properties and produces healthy formulations with antioxidant properties [13-15]. According to Pauliuc, et al. [16], thyme honey contains many sugars, including fructose, glucose, sucrose, turanose, maltose, trehalose, melezitose, and affinose. At the same time, ripened mango fruit is a good source of glucose, fructose, and sucrose sugars [17]. Lime is an excellent ascorbic acid source with antioxidant properties [18,19]. However, there are no reports of this combination of natural juice, fruit, and honey being used in candy or gummy candies as carriers of probiotic capsules. Therefore, this study aimed to produce probiotics-based healthy gummy candy by replacing sweeteners, flavorings, and colorings with honey, mango pulp, and lemon juice and evaluating the product' physicochemical and sensory properties and viability of probiotics capsules.
Culture probiotics preparation
Lactobacillus plantarum PTCC 1058 was obtained from the Persian Type Culture Collection center, Lactobacillus paracasei subsp. tolerans IBRC was obtained from the Iranian Biological Resource Center. The lyophilized Lactobacillus plantarum PTCC 1058 and Lactobacillus paracasei subsp. tolerans M11230 were activated separately in MRS broth at 37 °C for 24 h. Gram staining, catalase, and oxidase tests were performed to determine the purity of culture; after that, cells were centrifuged at 4000×g for 10 min at 4 °C and washed twice with sterile physiological serum (SPS) (NaCl2 0.85% w/v) then, re-suspended in 1 mL of SPS to obtained a suspension containing 9.72 ± 0.62 Log CFU/ mL and enumerated by the spread plate method onto MRS agar and incubated for 2 days at 37 °C.
Preparation of sodium alginate solution
The sodium alginate (ALG) solution preparation was modified from Gul and Dervisoglu [20]. The formula consisted of 6 g of ALG and 100 mL of boiling distilled water. The solution was vigorously stirred at room temperature for 20 min with the help of a magnetic bar; then, after being autoclaved at 121 °C for 15 min, it was refrigerated overnight.
Preparation of chitosan solution
The chitosan solution was prepared by adding 4 g of chitosan (Ch) to 1 L of acetic acid (1 M) and it was left on a stirrer at room temperature for 1 hour. Then, 5 M NaOH was added to adjust the pH to 6, and it was sterilized in an autoclave for 15 min at 121 °C [21].
Preparation of sodium alginate hydrogel capsules loaded with probiotics
ALG capsules loaded with probiotics were prepared according to Li, et al. [22] using an extrusion method with slight modification. 0.5 mL Lactobacillus plantarum with 0.5 mL Lactobacillus paracasei suspension was well mixed with 9 mL sterilized ALG solution. Then, the mixture was stirred using a magnetic bar at room temperature for 20 min at 100 rpm until a homogenous solution was obtained. The ALG-bacteria mixture was added dropwise through a 6 ml syringe (22-gauge needle) into 200 mL of 3% w/v CaCl2. The distance between the syringe and the CaCl2 solution was 10 cm and left for 30 min to hardness the ALG hydrogel capsules; the capsules were separated by a sieve and rinsed with an SPS solution. The capsules were kept in 0.1% peptone water at 4 °C for further use.
Preparation of sodium alginate coated-chitosan capsules
ALG capsules (4.5 g) were transferred into 0.5 mL Ch solution. The capsules were stirred gently with a magnetic bar for 1 hour at 100 rpm; after that, they were rinsed with an SPS solution and kept in peptone water (0.1 % w/v) at 4 °C.
Viable cells count
The viable encapsulated and free probiotics cells were counted using the spread plate method [23]. ALG/Ch capsules (1 g) were dissolved in 9 mL 1% w/v sterile sodium citrate under constant stirring at 100 rpm for 10-15 min at ambient temperature. Serial dilutions were prepared in (0.2%) peptone water and spread on MRS agar. After 24-48 h incubation at 37 °C, the viable probiotic cells were counted and expressed in log CFU/mL.
Encapsulation efficiency % measurement
The encapsulation efficiency percentage (EE%) was calculated according to Equation 1 as proposed by De Araújo Etchepare, et al. [24].
(1)
N is the Log (CFU/ mL) of viable cells released from the hydrogel beads.
N0 is the initial Log (CFU/ mL) of the viable cells used for encapsulation.
Capsules' size measurement
The diameters of the wet capsules were measured with the help of a compound microscope (Carl Zeiss, Germany) and Image J processing software. An average of 3 capsule diameters was measured.
Production of capsules/ free cells- based healthy gummy candy
All the ingredients have been purchased from the local market in the Islamic Republic of Iran. Healthy gummy candy (HGC) production was modified by Kamil, et al. [25]. Bovine gelatin sheets were soaked in 50 ml of cold water for 10 minutes to bloom, and then the gelatin solution was entirely dissolved by heating at (70 °C – 75 °C) in a water bath for 15 minutes. Next, water, lemon juice, thyme honey, and mango pulp were mixed in a blender, and then the fruit solution and blooming gelatin were blended until there were no lumps.
To prepare the probiotic capsules-based HGC (HGC-C), the gummy mixture was cooled to 45 ˚C then, poured into silicone molds (1x1 cm). 5 probiotic capsules were placed in each mold well; the molds were then placed in the refrigerator for 2 hours. The HGC-C pieces were removed from the molds and placed on plastic wrap to dry in the refrigerator for three days at 4 °C.
To prepare the free cells-based HGC (HGC-F), 1 mL of probiotics suspension was added to 9 mL of the gummy mixture (45 ˚C) under constant stirring for 10 min at ambient temperature. Then, the molds were placed in the refrigerator for 2 hours. The HGC-F pieces were removed from the molds and placed on plastic wrap to dry in the refrigerator for three days at 4 °C.
Physicochemical characteristics of HGC
PH, TSS %, titratable acidity %, protein, and moisture % were measured using the methods of AOAC [6]. pH and total soluble sugars were measured using a pH meter (Consort C830, Belgium) and a refractometer (Bellingham+Stanley Limited, England). TA estimation was measured as citric acid %, and the sample was titrated with (0.1 N) NaOH and 3-5 drops of 1% phenolphthalein indicator. The percentage TA was calculated using Equation 2.
(2)
V is a titer volume of NaOH
m is a mass of HGC (g)
0.064 is a milliequivalent of citric acid
The moisture content was estimated by heating the sample using an oven and sitting at 105 ˚C for 4 hours. It was weighed once more until it reached a constant weight after cooling in a desiccator. The following equation (Equation 3) was used to calculate the % of moisture content [26].
(3)
W1 is the weight of the sample before treatment (g).
W2 is the weight of the sample after treatment (g).
The percentage of total nitrogen was estimated using the Kjeldahl method. The sample was digested using concentrated sulfuric acid with catalysts, followed by distillation and titration with hydrochloric acid. Then, the total nitrogen in the sample was measured and multiplied by a conversion factor (6.25).
Determination of total phenolic content (TPC) and antioxidant activity %
Preparation of HGC extract: The extract was prepared with slight modifications. 1 g of HGC-C sample mixed with 5 ml of 80% methanol, then left on stirrer at room temperature in the dark for two hours. The mixture was filtered through Whatman No.1 filter paper to obtain a clear supernatant; afterward, it was centrifuged at 6000 x g for 10 min and used to determine total phenolic content and antioxidant activity % [27].
Total phenolic contents measurement
The total phenolic content (TPC) of the methanolic crude extracts of HGC was estimated using theFolin–Ciocâlteu reagent described by Ben Rejeb, et al. [27]. Suspended 300 μL of a crude extract with 300 μL of 10% Folin–Ciocâlteureagent and vortexed for 1-2 min, followed by the addition of 1 mL of 7% Na2CO3; then the mixture was vortexed and stood for 30 min at room temperature in the dark for colour development. The mixture was filtered through Whatman filter paper No. 1. Absorbance was measured at 760 nm wavelength. The final result was expressed as mg GAE per g of HGC weight.
Stock gallic acid solution
The stock solution was prepared by dissolving 0.500 g gallic acid in 10 mL of 80% methanol and then, making the volume 100 mL with distilled water in a 100 mL volumetric flask to get the concentration of 5 mg/mL [28].
Preparation of standard Gallic acid curve
The calibration curve was plotted by adding 0, 0.2, 1, 2, 3, 5, and 10 mL aliquots of stock gallic acid solution into 100 mL volumetric flasks and then diluting to volume with distilled water to get 0.01, 0.05, 0.1, 0.15, 0.25, and 0.50 mg/mL concentration of gallic acid; every concentration was mixed with 300 μL of 10% Folin–Ciocâlteu reagent and vortex for 1-2 min followed by 1mL of 7% of Na2CO3 and vortexed, the absorbance was measured at 760 nm.
The amount of TPC in the HGC-C samples was obtained using the following equation (Equation 4) [29].
(4)
TPC is the total phenolic content (mg/g) in gallic acid equivalent (GAE)
C is the concentration of gallic acid obtained from the gallic acid standard curve (mg/mL)
V is the volume of extract (mL)
m is the mass of extract (g)
Antioxidant activity %
Crude extract (2 mL) was added to 2 mL of freshly prepared DPPH (0.0024 mg DPPH in 100 mL 80% methanol), then well vortexed and allowed to stand for 30 min in the dark. The absorbance was measured at 517 nm (Equation 5) [30].
(5)
A0 = is a DPPH absorbance
A1 = is a sample absorbance
Texture profile analysis of HGC
The texture profile analysis (TPA) was performed with an AMETEK Brookfield texture analyzer by Herrero, et al. [31]. The texture profile parameters hardness, adhesiveness, resilience, fracturability, cohesiveness, springiness, gumminess, and chewiness were determined. Block shape HGC with dimensions of approximately 8 × 9 mm (W x H) and a depth of 10 mm. The HGC sample was positioned in the sample testing region; then, the flat cylindrical probe (TA4/1000) was lowered to the sample with a load of 10,000 grams, compressed, and penetrated the sample at a speed of 2 mm/s and pretest speed of 2 mm/s, then returned to its starting point at 2 mm/s.
Colour intensity
The color of the top and bottom HGC samples was measured using a color analyzer; their values of lightness (L*), redness/greenness (+ a* / - a*) and yellowness/ blueness (+b* / - b*) was determined [32].
The survivability % of probiotics in the HGC
The survivability % of free and encapsulated probiotics cells during refrigeration storage for 48 days for HGC samples was determined. The count of surviving encapsulated and free cells on days 0, 3, 6, 9, 12, 15, 18, 21, 24, 27, 30, 36, 42 and 48 were assessed. HGC-C sample (~1 g, 1 block) was suspended in 1% sodium citrate, followed by vigorously stirring at 30 ˚C for 15-20 min. Tenfold was serially diluted in 0.2% peptone water, plated on MRS plates using the spread plate technique, and incubated for 48 h at 37 °C. The bacteria were enumerated as colony-forming units per gram (CFU/g). All samples were counted in triplicates (Equation 6) [33].
Survivability % = (Nt /N0) x 100 (6)
N0 = The Log (CFU/mL) of the viable cell counts at the zero time
Nt = The Log (CFU/mL) of the viable cells counts at various exposure times (t)
HGC-F sample (~1g, 1 block) was suspended in 0.2% peptone water, then stirred at 30 ˚C for 10-15 min. A set of serial dilutions was made with peptone water, and the colony forming units (CFU/g) were determined by spread method on MRS agar plates and incubation for 48 h at 37 ˚C. All samples were counted in triplicates [34].
Sensory properties tests
Ten assessors conducted a sensory analysis of the HGC-C after one week of refrigerated storage. Supplement sample attributes, including taste, odor, color, mouthfeel, aftertaste, and overall acceptability, were scored on an increasing scale ranging from 1 (extremely dislike) to 5 (extremely like).
Statistical analysis
Data were subjected to analysis of two-way variance (ANOVA) using GeneStat Release 10.3 DE Software. The mean value and ± standard deviation at least triplicate were calculated. Differences were identified as significant at p ≤ 0.05.
The capsules' morphology, sizes, and encapsulation efficiency %
Lactobacillus plantarum and Lactobacillus paracasei were gram positive, short to long rod shape, catalase and oxidase negative. All capsules were spherical and had a whitish-yellow color due to the natural color of the alginate and chitosan materials employed in the coating [35]. In addition, the capsule size is a crucial factor in the encapsulation technique; the chitosan-alginate capsule size was 2.13 ± 0.10 (Table 1).
| Table 1: The capsules' sizes and encapsulation efficiency %. | ||||
| Formulation | Initial loading of the cells Log (CFU/mL) before encapsulation | Final loading of cells Log (CFU/ mL) after encapsulation | Capsules' size average (mm) | *EE % |
| ALG-Ch capsules | 9.72 ± 0.62A | 8.57 ± 0.34A | 2.13 ± 0.10 | 88.16 |
| A Means having the same letters in the row are not significantly different (p > 0.05) *EE% = Encapsulation efficiency %. |
||||
Physicochemical characteristics of HGC
The HGC samples had a pH value of 4 ± 0.1 (Table 2). The added lime juice to HGC samples decreased the pH of the final product. These results agreed with the results of Niam, et al. [36], who found that the pH value of gummy candies was 4.26–4.57. In confectionery factories, pH is frequently determined to control the degree of hydration; furthermore, it plays a crucial role in preventing the growth of microorganisms [37]. TSS includes the total amount of sugar and negligible soluble proteins, amino acids, and other organic materials [38]. The total soluble solid (TSS) content of the HGC samples was 44 ± 1.5 ˚Brix lower than commercial gummy candies (74–80 ˚Brix) (Table 2) [39]. It is worth noting that the main sweeteners in gummy candy products are sucrose and glucose syrup, as the types of sugars and their concentrations might affect the percentage of TSS [40]. The titratable acidity % (TA%) rating indicates total acid content. It is a better indicator of the impact of acid contents on flavor than other methods, such as pH [41]. The HGC titratable acidity was 1.02 ± 0.01 (% as citric acid) (Table 2), which is higher than the result of Chalak, et al. [42] who found the titratable acidity range from 0.08% to 0.43%. Our result agreed with Abu Shama, et al. [43] work. Who reported that red peel candy's titratable acidity (% citric acid) was 1.052% after 4 weeks of cold storage (8 ± 2 °C).
| Table 2: Physicochemical composition of HGC. | |
| Physicochemical composition of HGC | |
| pH | 4 ± 0.1 |
| *TA% | 1.02 ± 0.01 |
| ⁑TSS% | 44 ± 1.5 |
| Protein% | 2.77 ± 0.01 |
| Moisture% | 28.43 ± 0.03 |
| ⁂TPC | 0.06 mg GAE /g |
| Antioxidant activity % | 91 ± 1 % |
Gummy candies' water content impacts their stability, texture, shelf life, and microbial growth [44]. The moisture of the HGC sample was 28.43 ± 0.03% (Table 2), and it had a high moisture content compared to commercial products. Ergun, et al. [45] stated that gummy candies typically have a moisture content of 8% to 22% or less. Gummy candies become harder as moisture level decreases, usually leading to a longer shelf life [45]. On the other hand, the quality, texture, and shelf life of gummy candies can be significantly influenced by their final moisture [39].
The higher moisture content in HGC compared to commercial gummies was due to corn syrup or glucose use in commercial gummy candies, while in HGC, honey was used as a sweetener. Corn syrup can absorb moisture when increasing dextrose equivalent (DE) [46]. Gummies' main ingredients are gelatin, agar, and pectin. Gelatin is a water-soluble polypeptide with a high molecular weight derived from the partial hydrolysis of collagen [47]. In addition, gelatin has unique properties such as water-holding, gelling, and thickening agents in food materials [48]. The HGC protein percentage was 2.77 ± 0.01% (Table 2). The low protein content was due to using a low amount of gelatin in the HGC formula; lime juice, thyme honey, and mango pulp are also low in protein content [49]. A Teixeira-Lemos, et al. [50] study showed that the protein concentration in 100 g of orange and honey gummy jellies and berries mix gummy jellies was 4.04 g and 3.25 g, respectively.
Total phenolic content and antioxidant activity %
The biological effects of phenolic compounds are varied, including anti-inflammatory, antibacterial, vasodilator effects, anticarcinogenic, antiviral, antithrombotic, antiallergic, and hepatoprotective [51]. TPC content and antioxidant activity of the prepared HGC are given in Table 2;
TPC content was 0.06 mg GAE/g, and high antioxidant activity % was 91 ± 1% at pH 4. Similar results were found by Ruenroengklin, et al. [52] and Ozcelik, et al. [53], the extract exhibited the highest antioxidant activity at pH 4.0 compared to other pH conditions (6.5 and 8.5).
The high value of antioxidant activity might be due to using lime juice in the HGC formula. Citrus fruit is a valuable source of antioxidant compounds, including flavonoids, phenolic compounds, and ascorbic acid, which are crucial in reducing cancer risk [54]. The high antioxidant activity % was noted in contrast to the concentration of total phenolic content, which was low. A decrease in TPC does not always lead to a decrease in antioxidant activity, as degradation products of phenolic compounds can sometimes have higher antioxidant activity than the original products [55,56]. Madalagiri, et al. [57] reported a lower level of antioxidant activity in mango pulp due to the lower level of total polyphenols and flavonoids, which are relatively higher in the peel. In addition, thyme honey is a good source of phenolic compounds with high antioxidant activity % (60.96%) [58]. Moreover, citric acid, mainly acid in Persian lime juice, acts as an antioxidant [59].
Probiotics survivability % in HGC
The number of encapsulated cells decreased from 6.98 ± 0.06 (100%) Log CFU/g to 3.88 ± 0.13 (55.42%) after 48 days of refrigeration storage (Table 3). On the other hand, the number of free cells decreased from 7.13 ± 0.10 (100%) Log CFU/g to 0.00 after 30 days of refrigeration storage. There was a significant difference (p < 0.05) in the encapsulated and free cells' numbers during storage. Encapsulated probiotic organisms showed much higher survival in HGC-C compared to HGC-containing free probiotic bacteria. The decrease in the cell's survival might be due to the low pH of Lime juice and oxygen in the HGC product. Therefore, to enhance the survival of probiotic bacteria in low-pH products, encapsulation was an effective method to protect cells from mild heat treatment and low-pH [60]. According to Sheehan, et al. [61] low-pH fruit juices, with a pH range between 2.5 and 3.7, increased bacterial sensitivity to stressful conditions. In addition, the presence of probiotic cells in low pH environments (below 4.5) leads to increased energy consumption to maintain the intracellular pH, which leads to a deficiency of ATP for other vital functions and cell death [62]. Oxygen can also lead to the formation and accumulation of toxic metabolites in cells, resulting in cell death due to oxidative damage [63].
| Table 3: Survival of encapsulated and free probiotics cells in the HGC during refrigeration storage (~ 4 °C) for 48 days. | ||||
| Days | The number of free cells Log (CFU/g) | Survivability % | The number of encapsulated cells Log (CFU/g) | Survivability % |
| 0 | 7.13 ± 0.10A | 100 | 6.98 ± 0.06A | 100 |
| 3 | 6.17 ± 0.13B | 88.14 | 6.74 ± 0.22A | 96.28 |
| 6 | 5.06 ± 0.28C | 72.28 | 6.56 ± 0.04B | 93.71 |
| 9 | 4.39 ± 0.09D | 68.71 | 6.53 ± 0.08B | 93.28 |
| 12 | 4.16 ± 0.15D | 59.42 | 6.43 ± 0.11B | 91.85 |
| 15 | 3.57 ± 0.07E | 51.00 | 5.87 ± 0.26C | 83.85 |
| 18 | 2.74 ± 0.49F | 39.14 | 5.65 ± 0.26C | 80.71 |
| 21 | 2.47 ± 0.38F | 35.88 | 5.52 ± 0.27C | 78.85 |
| 24 | 2.15 ± 0.03G | 30.71 | 5.33 ± 0.05D | 76.14 |
| 27 | 1.47 ± 0.15H | 21.00 | 5.27 ± 0.46D | 75.28 |
| 30 | 0.00 | 0 | 5.09 ± 0.19D | 72.71 |
| 36 | 0.00 | 0 | 4.75 ± 0.26E | 67.85 |
| 42 | 0.00 | 0 | 4.24 ± 0.38F | 60.57 |
| 48 | 0.00 | 0 | 3.88 ± 0.13F | 55.42 |
| A-H Means having the same letters in the column are not significantly different (p > 0.05). | ||||
Texture parameters
Compression test results comparing the texture of HGC with the control (commercial gelatin-based candy) showed that there was no significant effect (p > 0.05) on resilience (elasticity), and cohesiveness was observed. On the other hand, there are significant differences (p < 0.05) in hardness, adhesiveness (stickness), fracturability, springiness, gumminess, and chewiness (Figure 1). According to our results, all of the used ingredients (probiotics, mango pulp, lime juice, and thyme honey) reduced the hardness of the HGC texture [2]. The hardness value of HGC is lower than that of control gummy candy due to sugar being replaced with honey. It has been found in recent studies that adding sweeteners (xylitol) at a relatively low concentration (3% - 5%) increases the firmness and hardness of the gelled structure [64]. Higher energy is required to deform commercial gummy candy, and this is an undesirable characteristic for consumers, especially adults. Therefore, reducing the hardness led to greater acceptance of the product.
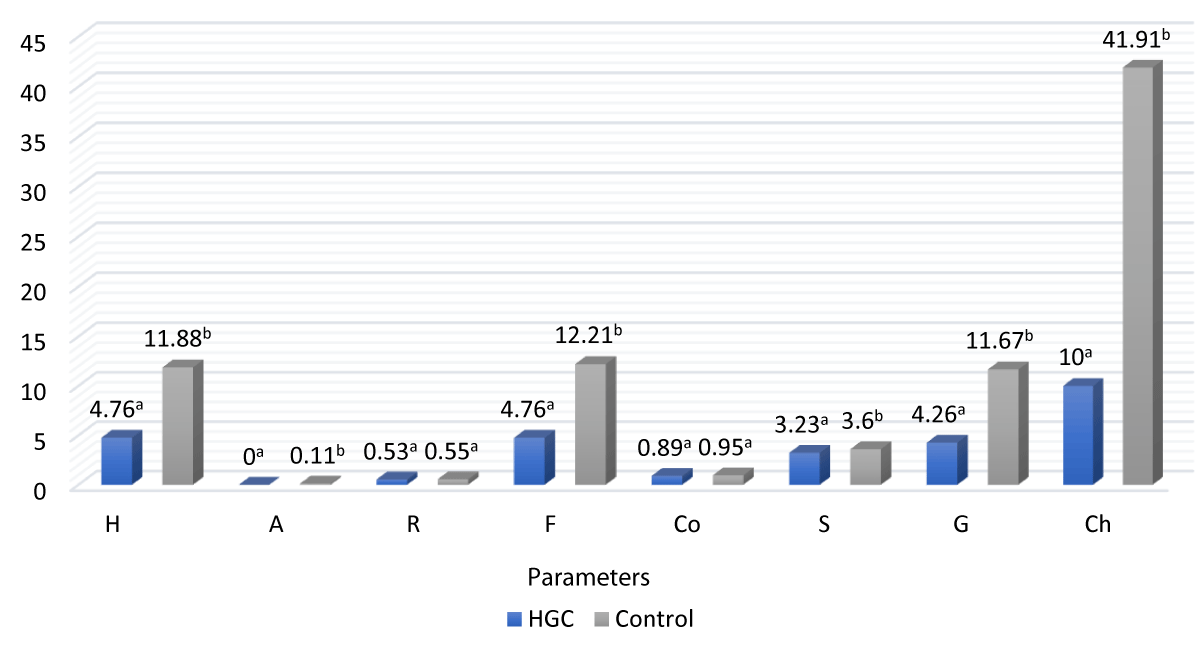
Figure 1: Texture profile analysis (TPA) of control and HGC samples combining the measurements of both sides (H: Hardness; A: Adhesiveness; R: Resilience; F: Fracturability; Co: Cohesiveness; S: Springiness; G: Gumminess and Ch: Chewiness. a-bMeans having the same letters between the two columns are not significantly different (p > 0.05)
| Table 3: Survival of encapsulated and free probiotics cells in the HGC during refrigeration storage (~ 4 °C) for 48 days. | ||||
| Days | The number of free cells Log (CFU/g) | Survivability % | The number of encapsulated cells Log (CFU/g) | Survivability % |
| 0 | 7.13 ± 0.10A | 100 | 6.98 ± 0.06A | 100 |
| 3 | 6.17 ± 0.13B | 88.14 | 6.74 ± 0.22A | 96.28 |
| 6 | 5.06 ± 0.28C | 72.28 | 6.56 ± 0.04B | 93.71 |
| 9 | 4.39 ± 0.09D | 68.71 | 6.53 ± 0.08B | 93.28 |
| 12 | 4.16 ± 0.15D | 59.42 | 6.43 ± 0.11B | 91.85 |
| 15 | 3.57 ± 0.07E | 51.00 | 5.87 ± 0.26C | 83.85 |
| 18 | 2.74 ± 0.49F | 39.14 | 5.65 ± 0.26C | 80.71 |
| 21 | 2.47 ± 0.38F | 35.88 | 5.52 ± 0.27C | 78.85 |
| 24 | 2.15 ± 0.03G | 30.71 | 5.33 ± 0.05D | 76.14 |
| 27 | 1.47 ± 0.15H | 21.00 | 5.27 ± 0.46D | 75.28 |
| 30 | 0.00 | 0 | 5.09 ± 0.19D | 72.71 |
| 36 | 0.00 | 0 | 4.75 ± 0.26E | 67.85 |
| 42 | 0.00 | 0 | 4.24 ± 0.38F | 60.57 |
| 48 | 0.00 | 0 | 3.88 ± 0.13F | 55.42 |
| A-H Means having the same letters in the column are not significantly different (p > 0.05). | ||||
The low variability between the two sides indicates that the HGC samples produced were uniform (Table 4). Teixeira-Lemos, et al. [50] reported an excellent uniformity between the two sides of the gummy jellies made with honey and fruits. The HGC has lower resilience than the control sample; this might be related to the difference in the ingredients of the two products [65]. In line with this, honey in gelatin systems will influence the product structure and rheological properties [66-68]. At the same time, adhesiveness or stickiness refers to the effort required to overcome attractive forces between the food surface and the surface of the substance with which the food is in contact (such as the tongue, teeth, and palate) [13]. Surface properties and the combined effect of adhesive and cohesive forces play a role in determining these values [69]. The use of glucose syrup and sucrose in commercial gummies led to a higher in the values of hardness and gumminess in the gummies [70], unlike the use of honey in the HGC, which had lower values of hardness, gumminess, and chewiness. The results showed a decrease in the gumminess of samples compared to the control due to fruits and honey being formulated, which meant less energy was required for breaking HGC. Our results are consistent with Moghaddas Kia, et al. [71] results, who observed a reduction in the gumminess of samples when gellan gum and red beet extract were formulated.
| Table 4: Texture profile analysis (TPA) on both sides of the control and HGC product. | ||||
| Texture parameters | HGC | Control | ||
| Top | Down | Top | Down | |
| Hardness N | 4.65 ± 0.23 | 4.88 ± 0.13 | 11.97 ± 0.32 | 11.79 ± 0.98 |
| Adhesiveness mJ | 0 | 0 | 0.13 ± 0.05 | 0.10 ± 1.69 |
| Resilience | 0.55 ± 0.05 | 0.51 ± 0.08 | 0.55 ± 0.02 | 0.56 ± 0.03 |
| Fracturability N | 4.65 ± 0.23 | 4.88 ± 0.13 | 12.15 ± 0.45 | 12.27 ± 0.96 |
| Cohesiveness | 0.93 ± 0.02 | 0.85 ± 0.04 | 0.96 ± 0.04 | 0.94 ± 0.05 |
| Springiness mm | 3.18 ± 0.04 | 3.28 ± 0.04 | 3.58 ± 0.18 | 3.62 ± 0.24 |
| Gumminess N | 4.36 ± 0.26 | 4.16 ± 0.17 | 11.74 ± 0.56 | 11.61 ± 1.06 |
| Chewiness mJ | 10 ± 0.00 | 10 ± 0.00 | 41.93 ± 0.51 | 41.90 ± 2.12 |
Color intensity
Figure 2 a, b, and c show the color coordinates of the HGC on both sides analyzed, top and bottom; the results on the two sides were very similar. The color coordinates a* showed positive values for the HGC samples (15.9-15.38). The color coordinates b* showed positive values for both sides of the sample (22.94-23.75). The values of L* were positive (24.07-26.18). In general, the results of the color evaluation confirmed that the HGC was clear, more yellow, with a more intense red color. Also, no (non-enzymatic browning reactions) were observed during HGC production due to the moderate heat used. The uniformity of HGC between the two sides has been observed. Previous results for gummy jellies made with a mix of berries and oranges with honey have also shown good uniformity between the two sides of the product [50]. Moreover, carotenoid pigments found in ripe mango fruit provide an alternative to artificial colorings and have additional beneficial health effects [72].
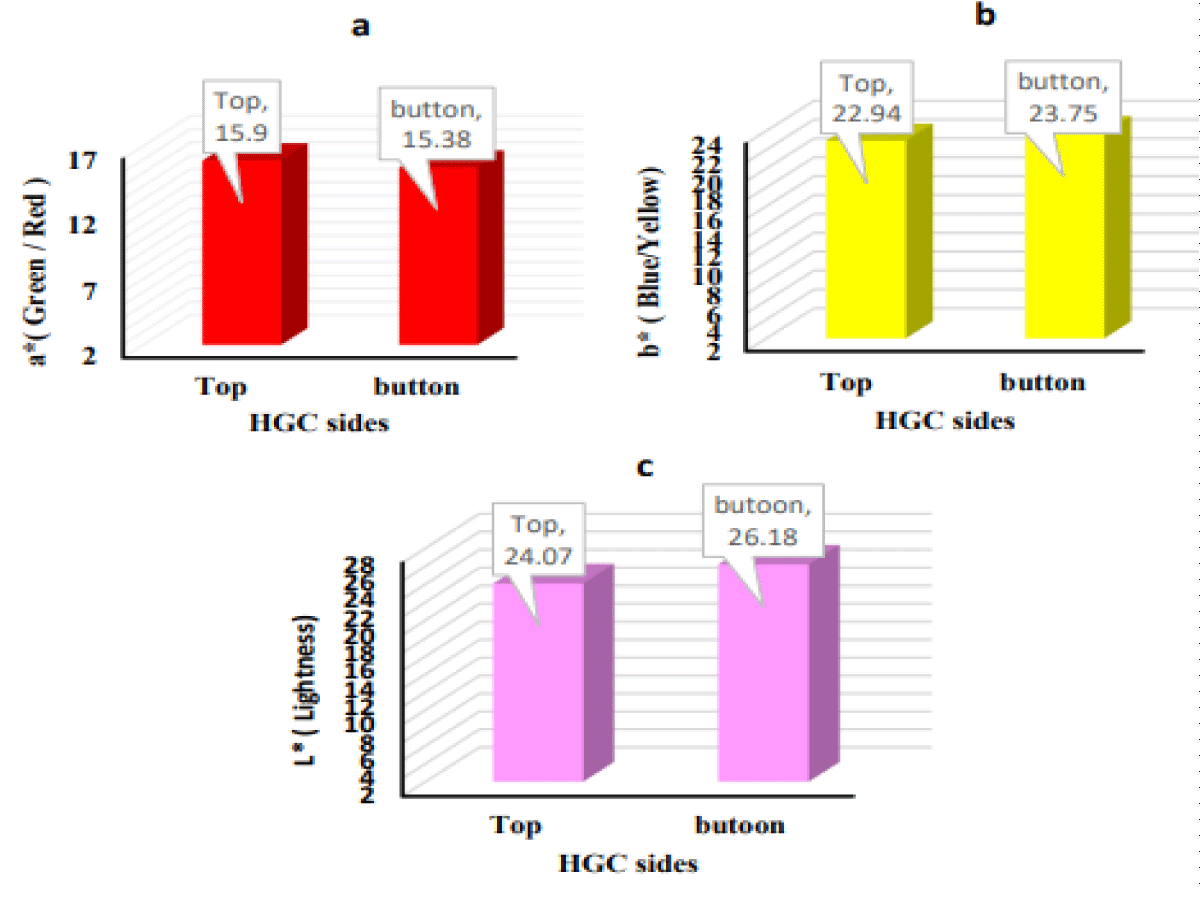
Figure 2: Color coordinates measured on both sides of the HGC, a) Green/Red, b) Blue/Yellow, and c) Lightness.
Sensory evaluation
The fundamental values for sensory evaluation of HGC are taste, odor, color, mouthfeel, after-taste, and overall acceptability shown in Table 5. Taste, mouthfeel, and overall acceptability had the highest scores and were chosen by panelists. Respondents knew the benefits of probiotics inspired by fermented dairy, and nutritional value was essential to evaluating the HGC. HGC product targets all consumer categories and provides an ideal dessert for children and adults interested in healthy sweets. The scores for color and odor were the lowest compared with other parameter scores due to using natural materials without any artificial food additives [73].
| Table 5: Sensory evolution of HGC product. | |
| Parameters | Scores average |
| Taste | 4.1 ± 0.73 |
| Odor | 3.6 ± 0.69 |
| Color | 3.9 ± 0.56 |
| Mouthfeel | 4 ± 0.47 |
| After taste | 4.2 ± 0.63 |
| Overall acceptability | 4.1 ± 0.31 |
Natural materials and probiotics-based functional food are well accepted and have a higher market demand. Incorporating healthy ingredients such as fruits as natural flavors and colorings and honey as a natural sweetener to improve the low health profile of gummy confectionery products is a promising strategy. In the current study, encapsulated probiotics in sodium alginate and chitosan provide a high encapsulation efficiency of 88.16%. Moreover, chitosan-coated alginate capsules in HGC products indicated maximum viability and minimum log reduction during storage than free cells. The natural ingredients significantly affect the textural properties (p < 0.05). Our research has shown that it seems possible to obtain gummy candies with acceptable sensory properties, which can also be marketed as healthy gummy candies without artificial or additive materials, as well as a good source of probiotics to restore microbial balance in the human digestive system. In addition, the HGC product was considered an excellent carrier of probiotics and a good source of antioxidants. Further research is needed to explore different formulations and improve sensory attributes, which could enhance the shelf life and effectiveness of probiotic-based gummies over time.
The authors declare that no financial support for the research, authorship, and/or publication were received during the preparation of this manuscript.
Author contributions
All authors contributed to the study's conception and design. Material preparation, data collection, and analysis were performed by Raghda Abdulhussain Kareem, Seyed Hadi Razavi, and Zeinab Mousavi. Seyed Hadi Razavi wrote the manuscript's first draft, and all authors commented on previous versions. All authors read and approved the final manuscript.
- Albuquerque BR, Oliveira MBP, Barros L, Ferreira IC. Could fruits be a reliable source of food colorants? Pros and cons of these natural additives. Crit Rev Food Sci Nutr. 2021;61(5):805-835. Available from: https://doi.org/10.1080/10408398.2020.1746904
- Lele V, Ruzauskas M, Zavistanaviciute P, Laurusiene R, Rimene G, Kiudulaite D, et al. Development and characterization of gummy–supplements enriched with probiotics and prebiotics. CyTA J Food. 2018;16(1):580-587. Available from: https://doi.org/10.1080/19476337.2018.1433721
- Lerner A, Shoenfeld Y, Matthias T. Probiotics: if it does not help it does not do any harm. Really? Microorganisms. 2019;7(4):104. Available from: https://doi.org/10.3390/microorganisms7040104
- Minj J, Chandra P, Paul C, Sharma RK. Bio-functional properties of probiotic Lactobacillus: current applications and research perspectives. Crit Rev Food Sci Nutr. 2021;61(13):2207-2224. Available from: https://doi.org/10.1080/10408398.2020.1774496
- Nikmaram P, Mousavi SM, Emam-Djomeh Z, Kiani H, Razavi SH. Evaluation and prediction of metabolite production, antioxidant activities, and survival of Lactobacillus casei 431 in a pomegranate juice supplemented yogurt drink using support vector regression. Food Sci Biotechnol. 2015;24:2105-2112. Available from: https://link.springer.com/article/10.1007/s10068-015-0279-5
- Ivanovska TP, Jurhar Pavlova M, Mladenovska K, Petrushevska Tozi L. Probiotics, prebiotics, synbiotics in prevention and treatment of inflammatory bowel diseases. Macedonian Pharm Bull. 2014;60(3):3-19. Available from: https://bulletin.mfd.org.mk/volumes/Volume%2060_2/60_2_001.pdf
- Kareem RA, Razavi SH. Plantaricin bacteriocins: as safe alternative antimicrobial peptides in food preservation—a review. J Food Saf. 2020;40(1). Available from: https://doi.org/10.1111/jfs.12735
- Sun Q, Yin S, He Y, Cao Y, Jiang C. Biomaterials and encapsulation techniques for probiotics: current status and future prospects in biomedical applications. Nanomaterials. 2023;13(15):2185. Available from: https://doi.org/10.3390/nano13152185
- Agriopoulou S, Tarapoulouzi M, Varzakas T, Jafari SM. Application of encapsulation strategies for probiotics: from individual loading to co-encapsulation. Microorganisms. 2023;11(12):2896. Available from: https://doi.org/10.3390/microorganisms11122896
- Bigdelian E, Razavi SH. Evaluation of survival rate and physicochemical properties of encapsulated bacteria in alginate and resistant starch in mayonnaise sauce. J Bioprocessing Biotech. 2014;4(5):1. Available from: http://dx.doi.org/10.4172/2155-9821.1000166
- Sessler T, Weiss J, Vodovotz Y. Influence of pH and soy protein isolate addition on the physicochemical properties of functional grape pectin confections. Food Hydrocolloids. 2013;32(2):294-302. Available from: https://doi.org/10.1016/j.foodhyd.2013.01.013
- Bartkiene E, Ruzauskas M, Lele V, Zavistanaviciute P, Bernatoniene J, Jakstas V, et al. Development of antimicrobial gummy candies with addition of bovine colostrum, essential oils and probiotics. Int J Food Sci Technol. 2018;53(5):1227-1235. Available from: https://doi.org/10.1111/ijfs.13701
- Mutlu C, Tontul SA, Erbaş M. Production of a minimally processed jelly candy for children using honey instead of sugar. LWT. 2018;93:499-505. Available from: https://doi.org/10.1016/j.lwt.2018.03.064
- Cano-Lamadrid M, Nowicka P, Hernández F, Carbonell-Barrachina AA, Wojdyło A. Phytochemical composition of smoothies combining pomegranate juice (Punica granatum L.) and Mediterranean minor crop purées (Ficus carica, Cydonia oblonga, and Ziziphus jujube). J Sci Food Agric. 2018;98(15):5731-5741. Available from: https://doi.org/10.1002/jsfa.9120
- De Moura SCSR, Berling CL, Garcia AO, Queiroz MB, Alvim ID, Hubinger MD. Release of anthocyanins from the hibiscus extract encapsulated by ionic gelation and application of microparticles in jelly candy. Food Res Int. 2019;121:542-552. Available from: https://doi.org/10.1016/j.foodres.2018.12.010
- Pauliuc D, Dranca F, Ropciuc S, Oroian M. Advanced characterization of monofloral honeys from Romania. Agriculture. 2022;12(4):526. Available from: https://doi.org/10.3390/agriculture12040526
- Bello-Pérez LA, García-Suárez FJ, Agama-Acevedo E. Mango carbohydrates. Food. 2007;1(1):36-40.
- Rahmiati N, Sari R, Wahyuni TS. Phytochemical and antioxidant activity evaluation of lime (Citrus aurantifolia) juice powder. Galenika J Pharm. 2023;9(2):197-207. Available from: http://dx.doi.org/10.22487/j24428744.2023.v9.i2.16347
- Kazeem MI, Bankole HA, Oladokun TI, Bello AO, Maliki MA. Citrus aurantifolia (Christm.) Swingle (lime) fruit extract inhibits the activities of polyol pathway enzymes. EFood. 2020;1(4):310-315. Available from: https://www.atlantis-press.com/journals/efood/125943793
- Gul O, Dervisoglu M. Application of multicriteria decision technique to determine optimum sodium alginate concentration for microencapsulation of Lactobacillus casei Shirota by extrusion and emulsification. Journal of Food Process Engineering. 2017;40(3):e12481. Available from: https://doi.org/10.1111/jfpe.12481
- Kamalian N, Mirhosseini H, Mustafa S, Abd Manap MY. Effect of alginate and chitosan on viability and release behavior of Bifidobacterium pseudocatenulatum G4 in simulated gastrointestinal fluid. Carbohydr Polym. 2014;111:700-706. Available from: https://doi.org/10.1016/j.carbpol.2014.05.014
- Li W, Chen W, Wang Z, Chen W, Zhang M, Zhong Q, et al. Preparation and characterization of beads of sodium alginate/carboxymethyl chitosan/cellulose nanofiber containing porous starch embedded with gallic acid: an in vitro simulation delivery study. Foods. 2022;11(10):1394. Available from: https://doi.org/10.3390/foods11101394
- Zeashan M, Afzaal M, Saeed F, Ahmed A, Tufail T, Ahmed A, et al. Survival and behavior of free and encapsulated probiotic bacteria under simulated human gastrointestinal and technological conditions. Food Sci Nutr. 2020;8(5):2419-2426. Available from: https://doi.org/10.1002/fsn3.1531
- De Araújo Etchepare M, Nunes GL, Nicoloso BR, Barin JS, Flores EMM, de Oliveira Mello R, et al. Improvement of the viability of encapsulated probiotics using whey proteins. LWT. 2020;117:108601. Available from: http://dx.doi.org/10.1016/j.lwt.2019.108601
- Kamil RZ, Fadhila FH, Rachmasari AD, Murdiati A, Juffrie M, Rahayu ES. Development of probiotic gummy candy using the indigenous Lactobacillus plantarum Dad-13 strain: evaluation of its gastrointestinal resistance and shelf-life prediction. Food Res. 2021;5(5):265-273. Available from: http://dx.doi.org/10.26656/fr.2017.5(5).731
- Association of Official Agricultural Chemists. Official methods of analysis of AOAC International. 18th ed. Arlington, USA; 2005.
- Ben Rejeb I, Dhen N, Kassebi S, Gargouri M. Quality evaluation and functional properties of reduced sugar jellies formulated from citrus fruits. J Chem. 2020;2020:1-8. Available from: https://doi.org/10.1155/2020/5476872
- Mahmood T, Bagga P, Siddiqui MH, Fareed S. Determination of total phenol & flavonoid content in seeds of Psoraleacorylifolia. Nat Prod Indian J. 2011;7(4):171-173. Available from: https://www.tsijournals.com/articles/determination-of-total-phenol--flavonoid-content-in-seeds-of-psoralea-corylifolia.pdf
- Bhatt BD, Parajuli GC. Study on total phenolic content (TPC), total flavonoid content (TFC), and antioxidant activities of Urtica dioica of Nepalese origin. J Nepal Chem Soc. 2017;37:113-118. Available from: https://doi.org/10.3126/jncs.v37i0.32169
- Mansouri FE, Farissi HE, Cacciola F, Esteves da Silva JC, Lovillo MP, Majdoub YOE, et al. Profiling the volatile and non-volatile compounds along with the antioxidant properties of malted barley. Separations. 2022;9(5):119. Available from: https://doi.org/10.3390/separations9050119
- Herrero AM, Ordóñez JA, de Avila R, Herranz B, De la Hoz L, Cambero MI. Breaking strength of dry fermented sausages and their correlation with texture profile analysis (TPA) and physico-chemical characteristics. Meat Sci. 2007;77(3):331-338. Available from: https://doi.org/10.1016/j.meatsci.2007.03.022
- Dag D, Kilercioglu M, Oztop MH. Physical and chemical characteristics of encapsulated goldenberry (Physalis peruviana L.) juice powder. LWT-Food Sci Technol. 2017;83:86-94. Available from: http://dx.doi.org/10.1016/j.lwt.2017.05.007
- Talebzadeh S, Sharifan A. Developing probiotic jelly desserts with Lactobacillus acidophilus. J Food Process Preserv. 2017;41(1). Available from: https://doi.org/10.1111/jfpp.13026
- Mawad A, Helmy YA, Shalkami AG, Kathayat D, Rajashekara G. E. coli Nissle microencapsulation in alginate-chitosan nanoparticles and its effect on Campylobacter jejuni in vitro. Appl Microbiol Biotechnol. 2018;102:10675-10690. Available from: https://doi.org/10.1007/s00253-018-9417-3
- Afzaal M, Saeed F, Ateeq H, Shah YA, Hussain M, Javed A, et al. Effect of cellulose–chitosan hybrid-based encapsulation on the viability and stability of probiotics under simulated gastric transit and in kefir. Biomimetics. 2022;7(3):109-121. Available from: https://doi.org/10.3390/biomimetics7030109
- Niam MLQ, Amin RS, Utami N, Wahyuni AS. Formulation of dietary supplement chewable gummy with bastard cedar leaves (Guazuma ulmifolia), senna leaves (Cassia angustifolia) and lime extracts using a simplex lattice design. In: Proceedings of the International Conference on Sustainable Innovation on Health Sciences and Nursing ICOSI-HSN. 2022;122-135. Available from: https://doi.org/10.2991/978-94-6463-070-1_17
- Tarahi M, Mohamadzade Fakhr-davood M, Ghaedrahmati S, Roshanak S, Shahidi F. Physicochemical and sensory properties of vegan gummy candies enriched with high-fiber jaban watermelon exocarp powder. Foods. 2023;12(7):1478. Available from: https://doi.org/10.3390/foods12071478
- Bexiga F, Rodrigues D, Guerra R, Brázio A, Balegas T, Cavaco AM, et al. A TSS classification study of ‘Rocha’ pear (Pyrus communis L.) based on non-invasive visible/near infra-red reflectance spectra. Postharvest Biol Technol. 2017;132:23-30. Available from: http://dx.doi.org/10.1016/j.postharvbio.2017.05.014
- Ge H, Wu Y, Woshnak LL, Mitmesser SH. Effects of hydrocolloids, acids and nutrients on gelatin network in gummies. Food Hydrocoll. 2021;113:106549. Available from: http://dx.doi.org/10.1016/j.foodhyd.2020.106549
- Hartel RW, von Elbe JH, Hofberger R. Jellies, gummies, and licorices. In: Hartel RW, von Elbe JH, Hofber R, editors. Confectionery Science and Technology. Cham, Switzerland: Springer International Publishing AG; 2018. Available from: https://link.springer.com/book/10.1007/978-3-319-61742-8
- Sadler GD, Murphy PA. pH and titratable acidity. In: Food Analysis. Boston: Springer; 2010. p. 219-238. Available from: https://link.springer.com/book/10.1007/978-1-4419-1478-1#page=219
- Chalak L, Younes J, Rouphael S, Hamadeh B. Morphological characterization of prickly pears (Opuntia ficus indica (L.) Mill.) cultivated in Lebanon. Int J Sci Res. 2014;3(6):2319-7064. Available from: https://www.ijsr.net/archive/v3i6/MjQwNjE0MDU=.pdf
- Abu-shama HS, Ahmed FA, Abd El-magied HED. Assessment of jelly candy manufactured from prickly pear fruits (Opuntia spp.). World J Adv Res Rev. 2022;16(1):767-783.
- Efe N. Characterization and formulation of gelatin-based soft candies. MSc thesis, Middle East Technical University; 2018. p. 125. Available from: https://hdl.handle.net/11511/27416
- Ergun R, Lietha R, Hartel RW. Moisture and shelf life in sugar confections. Crit Rev Food Sci Nutr. 2010;50(2):162-192. Available from: https://doi.org/10.1080/10408390802248833
- Tas O, Ertugrul U, Grunin L, Oztop MH. Investigation of the hydration behavior of different sugars by time domain-NMR. Foods. 2022;11(8):1148. Available from: https://doi.org/10.3390/foods11081148
- Liu D, Nikoo M, Boran G, Zhou P, Regenstein JM. Collagen and gelatin. Annu Rev Food Sci Technol. 2015;6:527-557. Available from: https://doi.org/10.1146/annurev-food-031414-111800
- Burey P, Bhandari BR, Rutgers RPG, Halley PJ, Torley PJ. Confectionery gels: A review on formulation, rheological and structural aspects. Int J Food Prop. 2009;12(1):176-210. Available from: https://doi.org/10.1080/10942910802223404
- Vincente AR, Manganaris GA, Ortiz CM, Sozzi GO, Crisosto CH. Nutritional quality of fruits and vegetables. In: Florkowski J, Shewfelt RL, Stanly E, editors. Postharvest Handling. Academic Press; 2014;69-169.
- Teixeira-Lemos E, Almeida AR, Vouga B, Morais C, Correia I, Pereira P, et al. Development and characterization of healthy gummy jellies containing natural fruits. Open Agric. 2021;6(1):466-478. Available from: http://dx.doi.org/10.1515/opag-2021-0029
- Haggag EG, Kamal AM, Abdelhady MI, El-Sayed MM, El-Wakil EA, Abd-El-hamed SS. Antioxidant and cytotoxic activity of polyphenolic compounds isolated from the leaves of Leucenia leucocephala. Pharm Biol. 2011;49(11):1103-1113. Available from: https://doi.org/10.3109/13880209.2011.568623
- Ruenroengklin N, Zhong J, Duan X, Yang B, Li J, Jiang Y. Effects of various temperatures and pH values on the extraction yield of phenolics from litchi fruit pericarp tissue and the antioxidant activity of the extracted anthocyanins. Int J Mol Sci. 2008;9(7):1333-1341. Available from: https://doi.org/10.3390%2Fijms9071333
- Ozcelik B, Lee JH, Min DB. Effects of light, oxygen, and pH on the absorbance of 2,2-diphenyl-1-picrylhydrazyl. J Food Sci. 2003;68(2):487-490. Available from: https://doi.org/10.1111/j.1365-2621.2003.tb05699.x
- Ashari H, Sadeghi N, Oveisi MR, Hajimahmoudi M. Total phenol, total flavonoid and ascorbic acid content of Iranian commercial orange juice. J Food Saf Hyg. 2020;6(1):22-27. Available from: https://doi.org/10.18502/jfsh.v6i1.6022
- Murakami M, Yamaguchi T, Takamura H, Atoba TM. Effects of thermal treatment on radical-scavenging activity of single and mixed polyphenolic compounds. J Food Sci. 2004;69(1):7-10. Available from: http://dx.doi.org/10.1111/j.1365-2621.2004.tb17848.x
- Buchner N, Krumbein A, Rohn S, Kroh LW. Effect of thermal processing on the flavonols rutin and quercetin. Rapid Commun Mass Spectrom. 2006;20(21):3229-3235. Available from: https://doi.org/10.1002/rcm.2720
- Madalageri D, Bharati PC, Orsat V, Raghavan V, Kage U. Antioxidant activity in pulp and peel of three mango varieties. J Horticult Sci. 2015;10(2):199-209. Available from: https://doi.org/10.24154/jhs.v10i2.130
- Gyergyák K, Boros B, Marton K, Felinger A, Papp N, Farkas Á. Bioactive constituents and antioxidant activity of some Carpathian basin honeys. Nat Prod Commun. 2016;11(2):245-250. Available from: https://doi.org/10.1177/1934578X1601100228
- Ali Abadi MHS, Karami-Osboo R, Kobarfard F, Jahani R, Nabi M, Yazdanpanah H, et al. Detection of lime juice adulteration by simultaneous determination of main organic acids using liquid chromatography-tandem mass spectrometry. J Food Compos Anal. 2022;105:104223. Available from: https://doi.org/10.1016/j.jfca.2021.104223
- Talebzadeh S, Sharifan A, Tarzi BG, Panah HE. Assessment of the possibility of probiotic jelly production using microencapsulation technique of Lactobacillus acidophilus bacteria. Int J Biosci. 2014;5(1):143-154. Available from: https://www.cabidigitallibrary.org/doi/full/10.5555/20143287118
- Sheehan VM, Ross P, Fitzgerald GF. Assessing the acid tolerance and the technological robustness of probiotic cultures for fortification in fruit juices. Innov Food Sci Emerg Technol. 2007;8(2):279-284. Available from: https://doi.org/10.1016/j.ifset.2007.01.007
- Chaudhary A. Probiotic fruit and vegetable juices: Approach towards a healthy gut. Int J Curr Microbiol App Sci. 2019;8(6):1265-1279. Available from: https://doi.org/10.20546/ijcmas.2019.806.154
- Boza-Méndez E, López-Calvo R, Cortés-Muñoz M. Innovative dairy products development using probiotics: challenges and limitations. Tech Costa Rica. 2012;10:213-236. Available from: http://dx.doi.org/10.5772/50104
- Cai L, Feng J, Regenstein J, Lv Y, Li J. Confectionery gels: Effects of low calorie sweeteners on the rheological properties and microstructure of fish gelatin. Food Hydrocoll. 2017;67:157-165. Available from: https://doi.org/10.1016/j.foodhyd.2016.12.031
- Guiné RP, Correia PM, Reis C, Florença SG. Evaluation of texture in jelly gums incorporating berries and aromatic plants. Open Agric. 2020;5(1):450-461. Available from: http://dx.doi.org/10.1515/opag-2020-0043
- Nguyen HTL, Katopo L, Pang E, Mantri N, Kasapis S. Structural variation in gelatin networks from low to high-solid systems affected by honey addition. Food Res Int. 2019;121:319-325. Available from: https://doi.org/10.1016/j.foodres.2019.03.048
- Belay A, Haki GD, Birringer M, Borck H, Addi A, Baye K, et al. Rheology and botanical origin of Ethiopian monofloral honey. LWT. 2017;75:393-401. Available from: http://dx.doi.org/10.1016/j.lwt.2016.09.021
- Kulmyrzaev A, McClements DJ. High frequency dynamic shear rheology of honey. J Food Eng. 2000;45(4):219-224. Available from: http://dx.doi.org/10.1016/S0260-8774(00)00062-5
- Hamedi F, Mohebbi M, Shahidi F, Azarpazhooh E. Ultrasound-assisted osmotic treatment of model food impregnated with pomegranate peel phenolic compounds: Mass transfer, texture, and phenolic evaluations. Food Bioprocess Technol. 2018;11:1061-1074. Available from: https://link.springer.com/article/10.1007/s11947-018-2071-z
- Tireki S, Sumnu G, Sahin S. Correlation between physical and sensorial properties of gummy confections with different formulations during storage. J Food Sci Technol. 2021;58:1-12. Available from: https://doi.org/10.1007/s13197-020-04923-3
- Moghaddas Kia E, Ghaderzadeh SL, Mojaddar Langroodi A, Ghasempour Z, Ehsani A. Red beet extract usage in gelatin/gellan based gummy candy formulation introducing Salix aegyptiaca distillate as a flavoring agent. J Food Sci Technol. 2020;57:3355-3362. Available from: https://doi.org/10.1007/s13197-020-04368-8
- Rumainum IM, Worarad K, Srilaong V, Yamane K. Fruit quality and antioxidant capacity of six Thai mango cultivars. Agric Nat Resour. 2018;52(2):208-214. Available from: https://doi.org/10.1016/j.anres.2018.06.007
- Dey S, Nagababu BH. Applications of food color and bio-preservatives in food and their effect on human health. Food Chem Adv. 2022;1:100019. Available from: https://doi.org/10.1016/j.focha.2022.100019